DataBloom
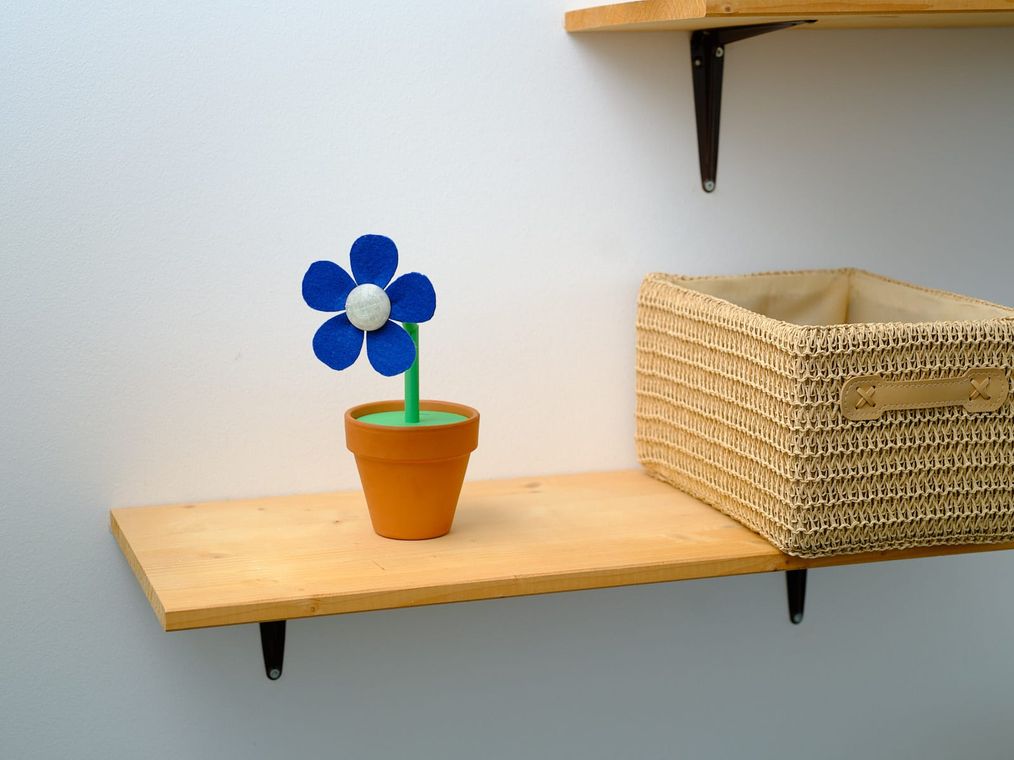
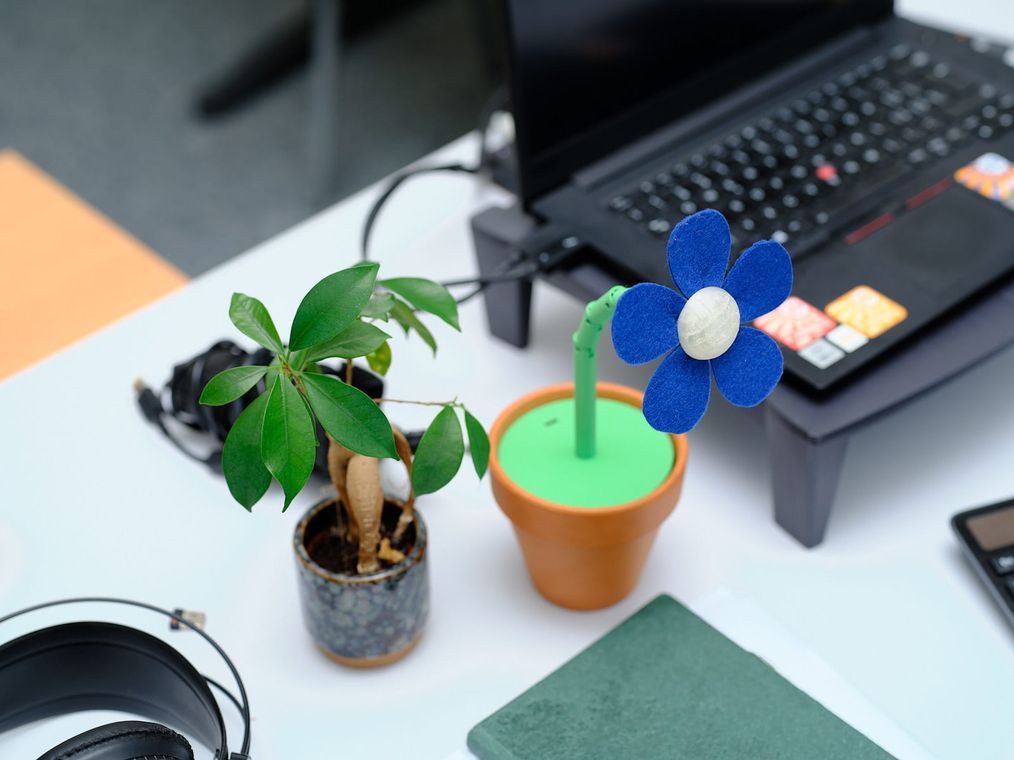
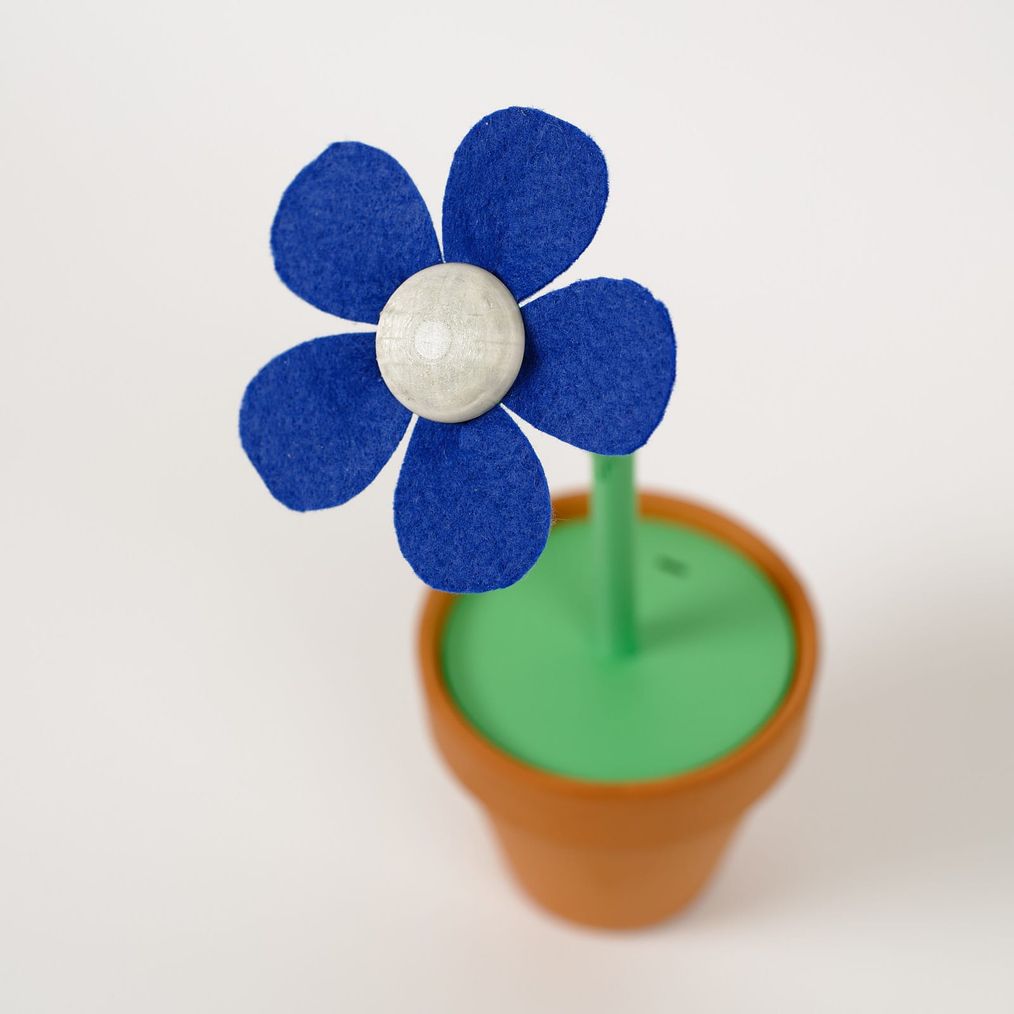
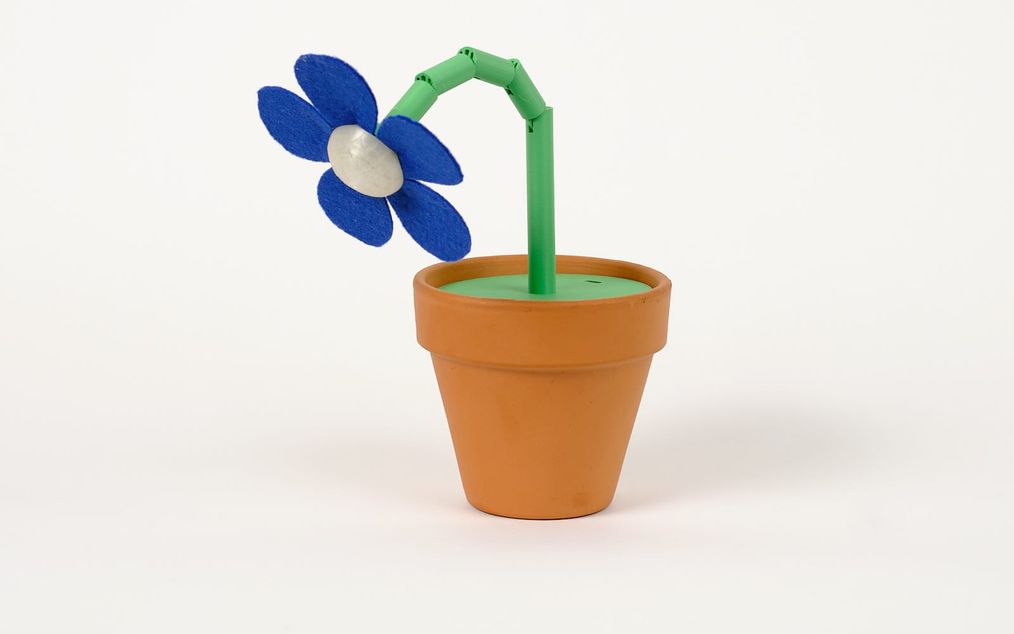
A tangible interface that makes the energy impact of digital usage perceptible at home. The flower's stem wilts as the household's weekly data consumption grows, and a light at the center signals the live data rate.
- Role
- Bachelor thesis, solo
- Year
- 2024 — 2025
- Host
- Media Engineering Institute (MEI), HEIG-VD
- Scope
- 4 research + 11 build weeks
- Shipped
- Functional prototype + thesis paper
Around 8% of Switzerland's electricity goes to digital infrastructure, and the digital sector accounts for 3 to 4% of global greenhouse-gas emissions, a share that could double or triple by 2030. Half of it comes from data centers and networks, the other half from the devices in our hands. Yet to the person using the network, none of it has a body.
Streaming a film, scrolling a feed, backing up to the cloud: all of it feels weightless. The infrastructure that carries those gestures stays invisible, so the cost stays invisible too, and there is nothing to react to. When an energy bill arrives it is a total with no story, and the detailed data, where a portal exists at all, stays out of sight.
The intuitive response (build another app) doubles down on the same problem. It hides the feedback behind a tap, in a phone already full of notifications, and only reaches people who cared enough to install it. So the brief narrowed. Give a household's digital energy use a physical presence in the room where life happens, without asking anyone to sign up, open an app, or remember to check.
- Project planning and methodology, a waterfall structure hybridised with Research through Design iterations
- Background research and positioning across tangible interfaces, data physicalization, and Calm Technology
- Concept and industrial design of the flower
- Mechanical design of the articulated stem
- Electronics integration and embedded firmware
- Two rounds of user testing: a comparative low-fidelity test, then an evaluation of the functional prototype
- Methodological calls taken with the mandate and supervisors, such as choosing the first concept by comparative test rather than by decision
- Framing the project against CarbonViz Home, the MEI's existing measurement work
- CarbonViz Home, the MEI system that measures a household's real digital energy use through a modified router. DataBloom runs on simulated data modeled on it, not on a live feed.
Solo thesis. Supervised by Olivier Ertz and Jonathan Favre-Lamarine (HEIG-VD), mandated by Stéphane Lecorney (Media Engineering Institute).
Why physicalize the invisible
The literature on eco-feedback points consistently in one direction: data that lives in the room people inhabit changes behavior more reliably than data behind a tap. The Fogg behavior model frames it precisely. A behavior appears when motivation, ability, and a trigger meet at the same moment. A quiet object in the home can be that trigger.
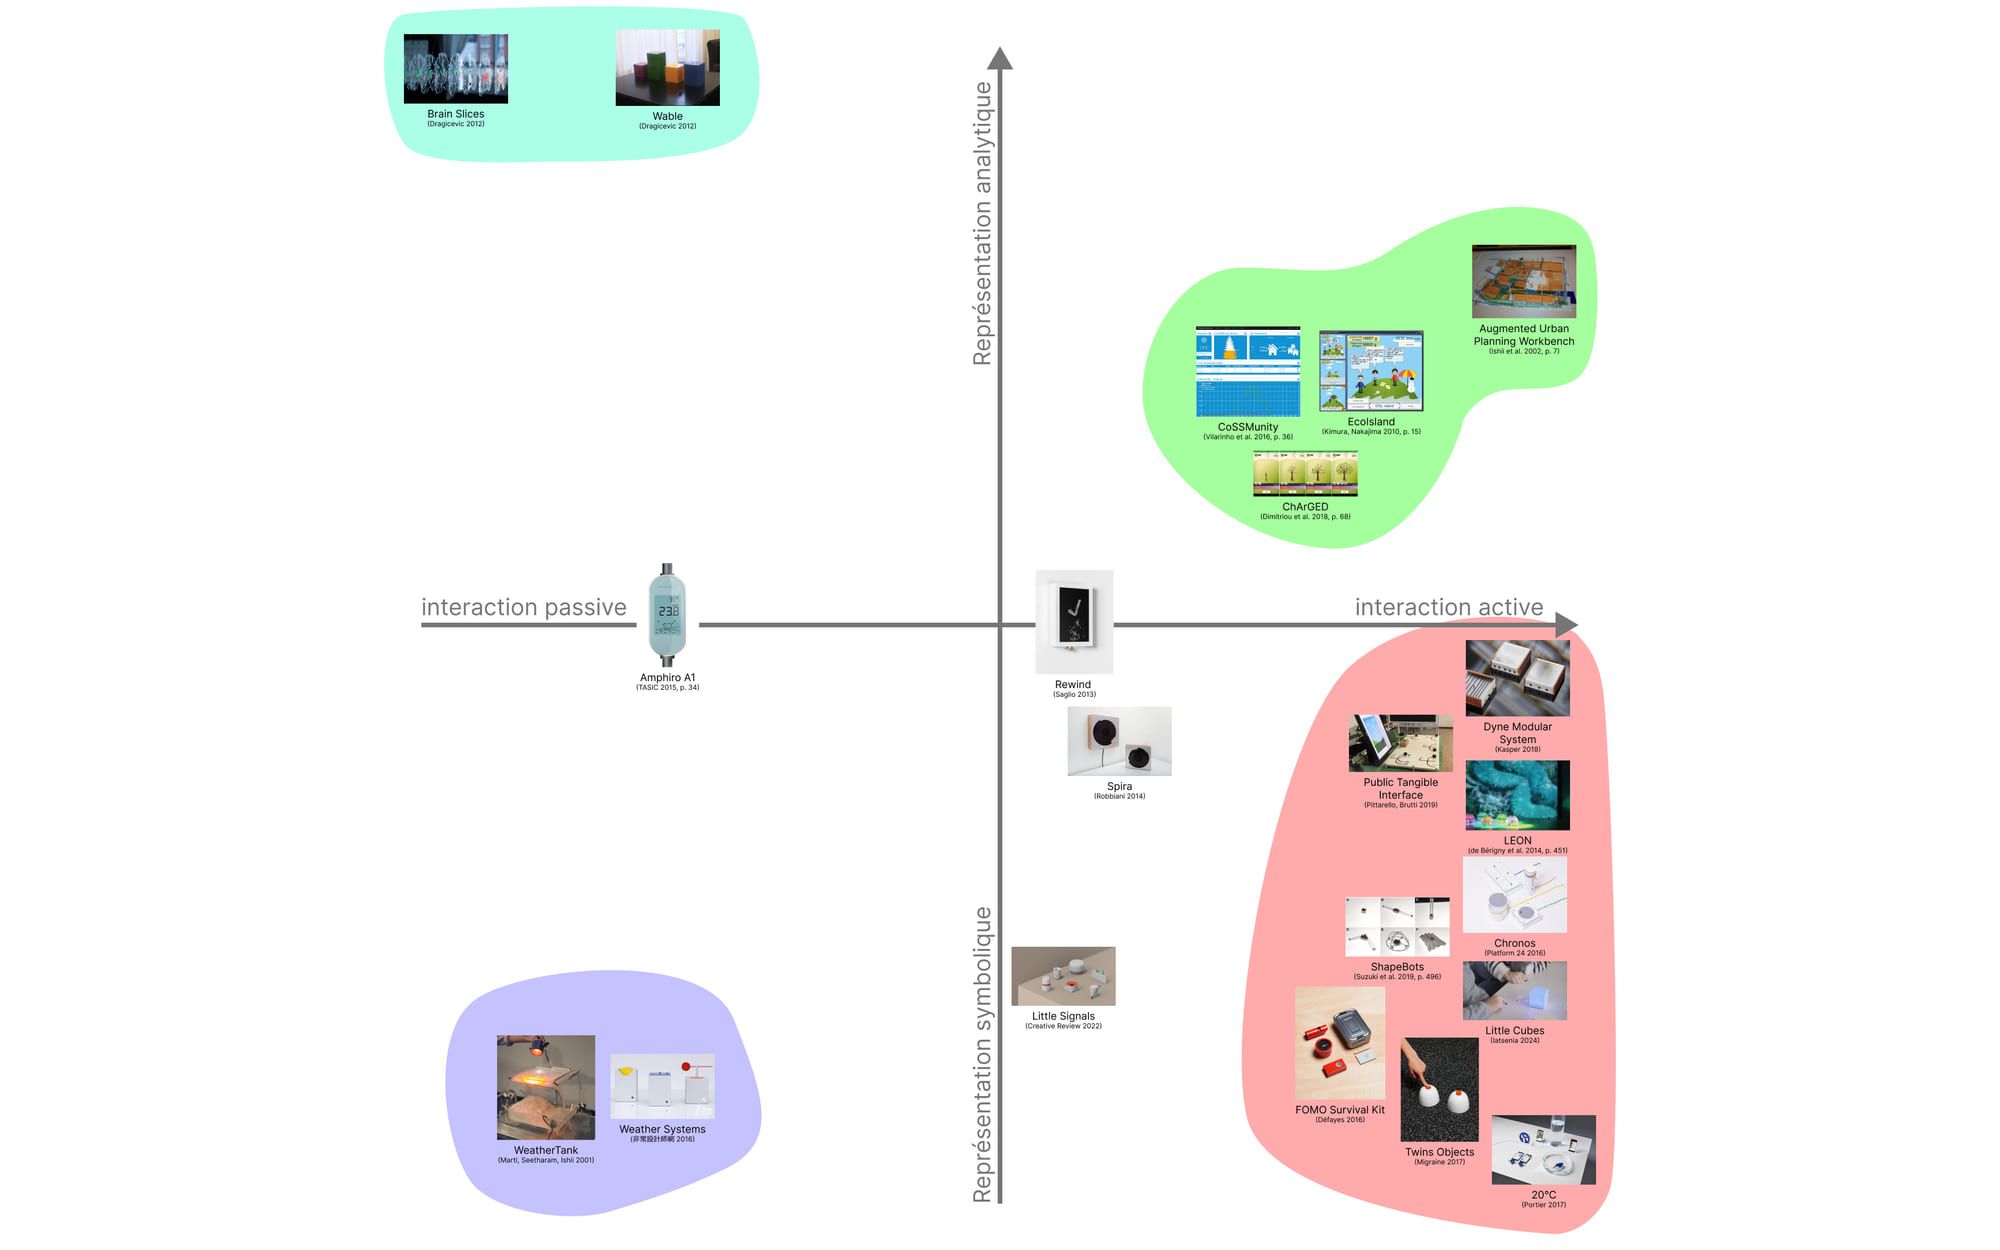
Energy visualization tends to fall into three families. Statistical (charts and dashboards), which is precise but ignored. Eco-visual metaphor (a tree wilting inside an app), which is engaging but still trapped behind a screen. And ambient physical, objects that change with consumption. The third family is the smallest and the most promising, because it earns the attention the room already gives the object.
Two metaphors worth testing
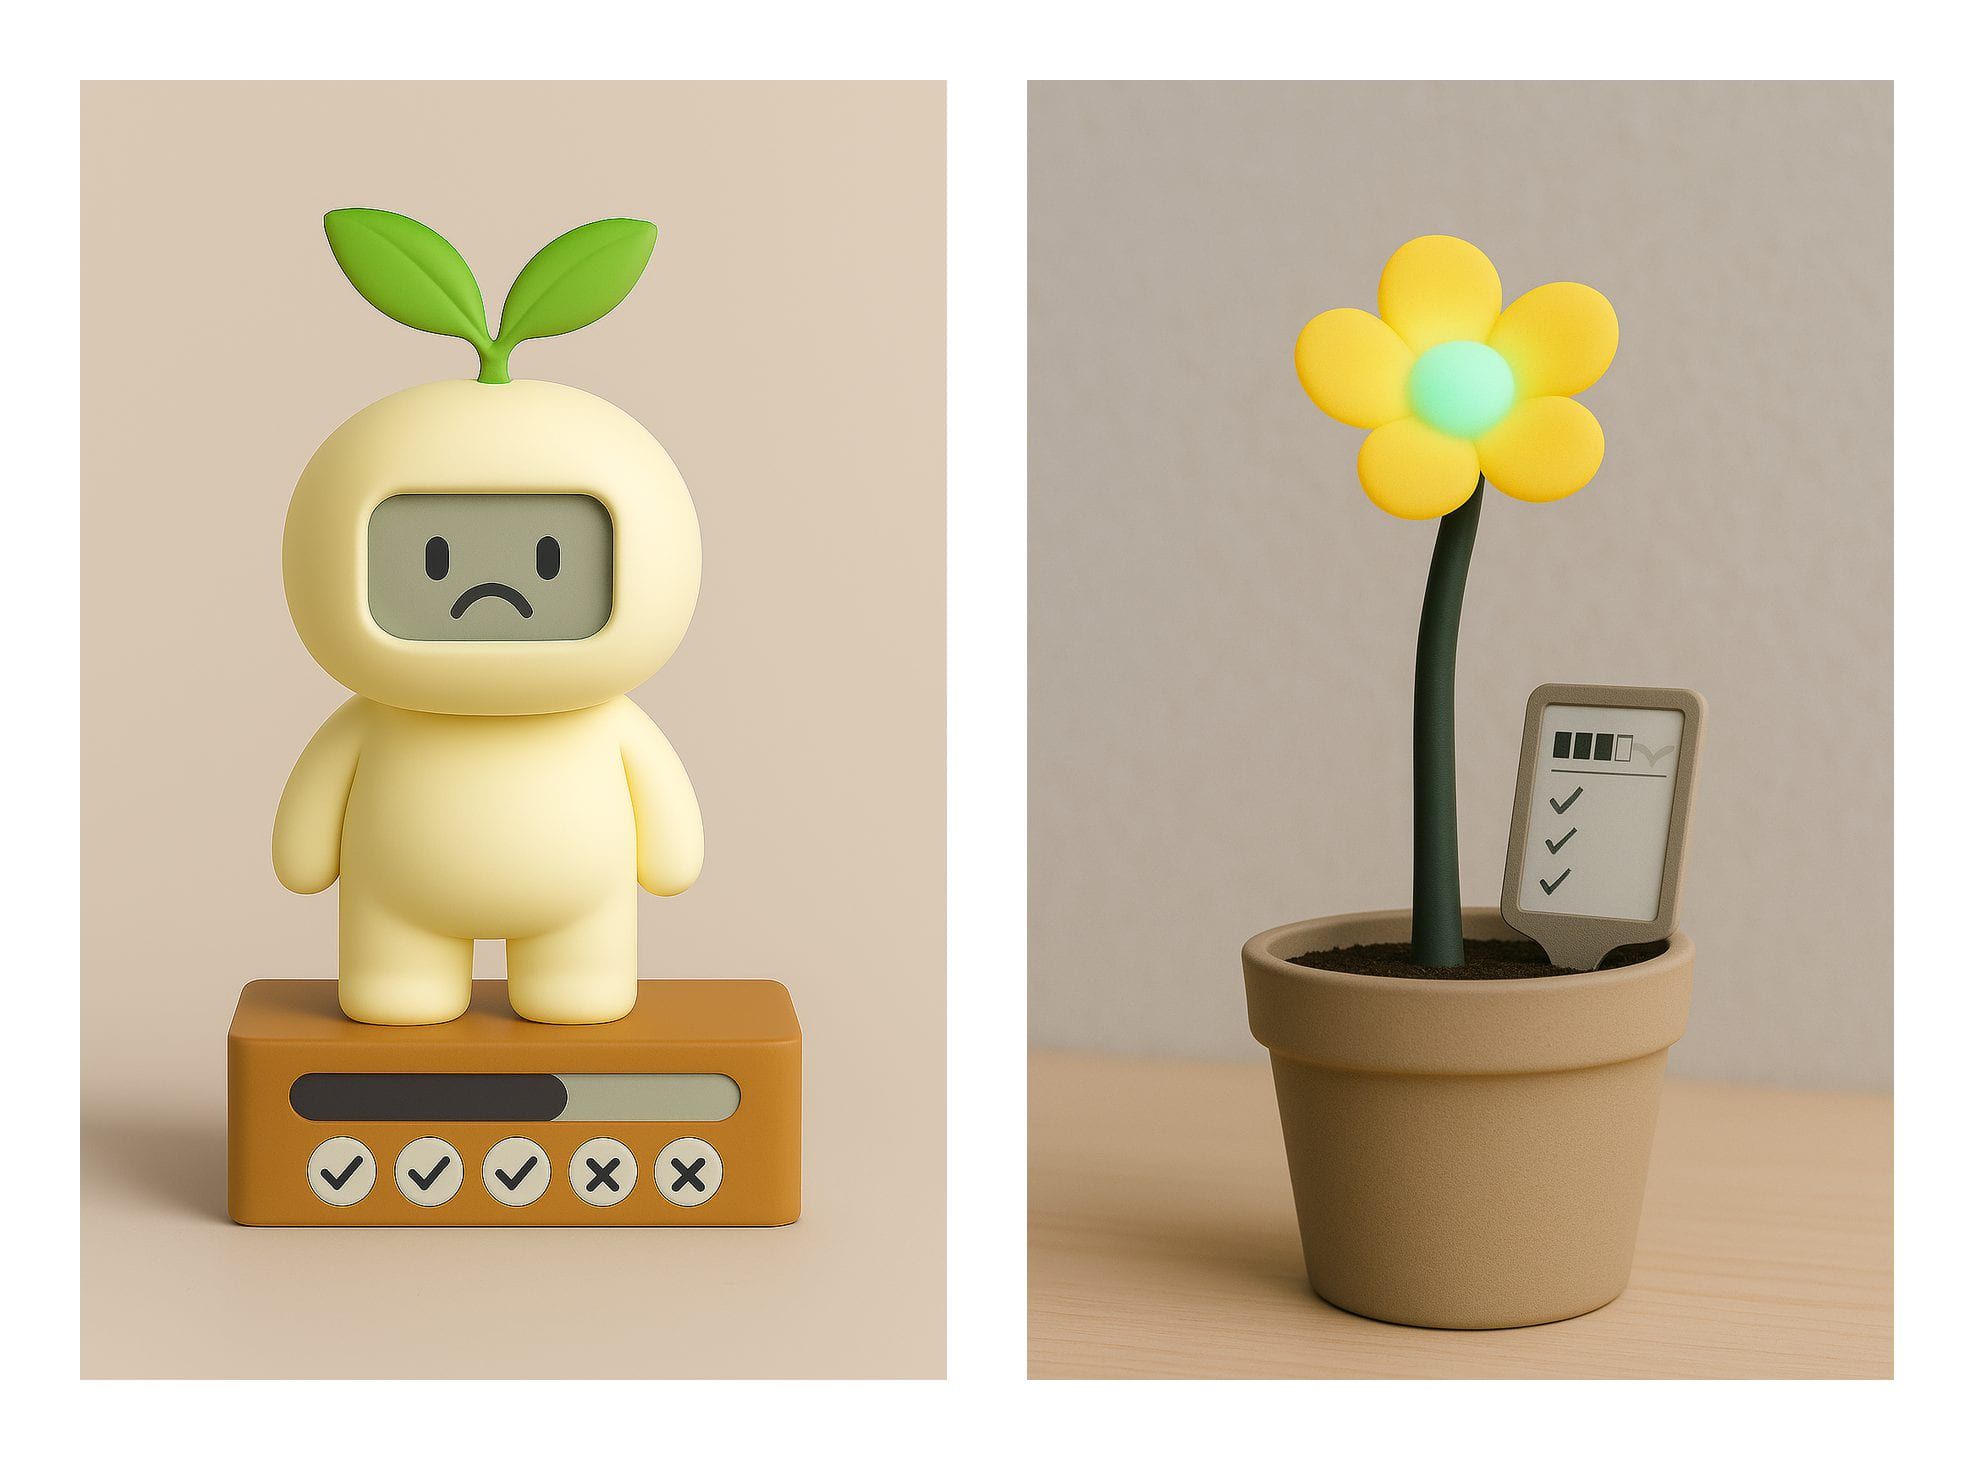
An ideation workshop turned the abstract brief into concrete directions. Two concepts went forward. A small expressive character whose world reacted to consumption, and a flower whose stem wilted as digital use climbed. Both fit the Calm Technology brief, each in a different register: one anthropomorphic, one drawn from nature.
Rather than choose on paper, the mandate and supervisors made a deliberate call: let a user test decide between them. That turned the first iteration into a comparison instead of a commitment, and kept the decision grounded in how people actually read each object.
Let the users choose
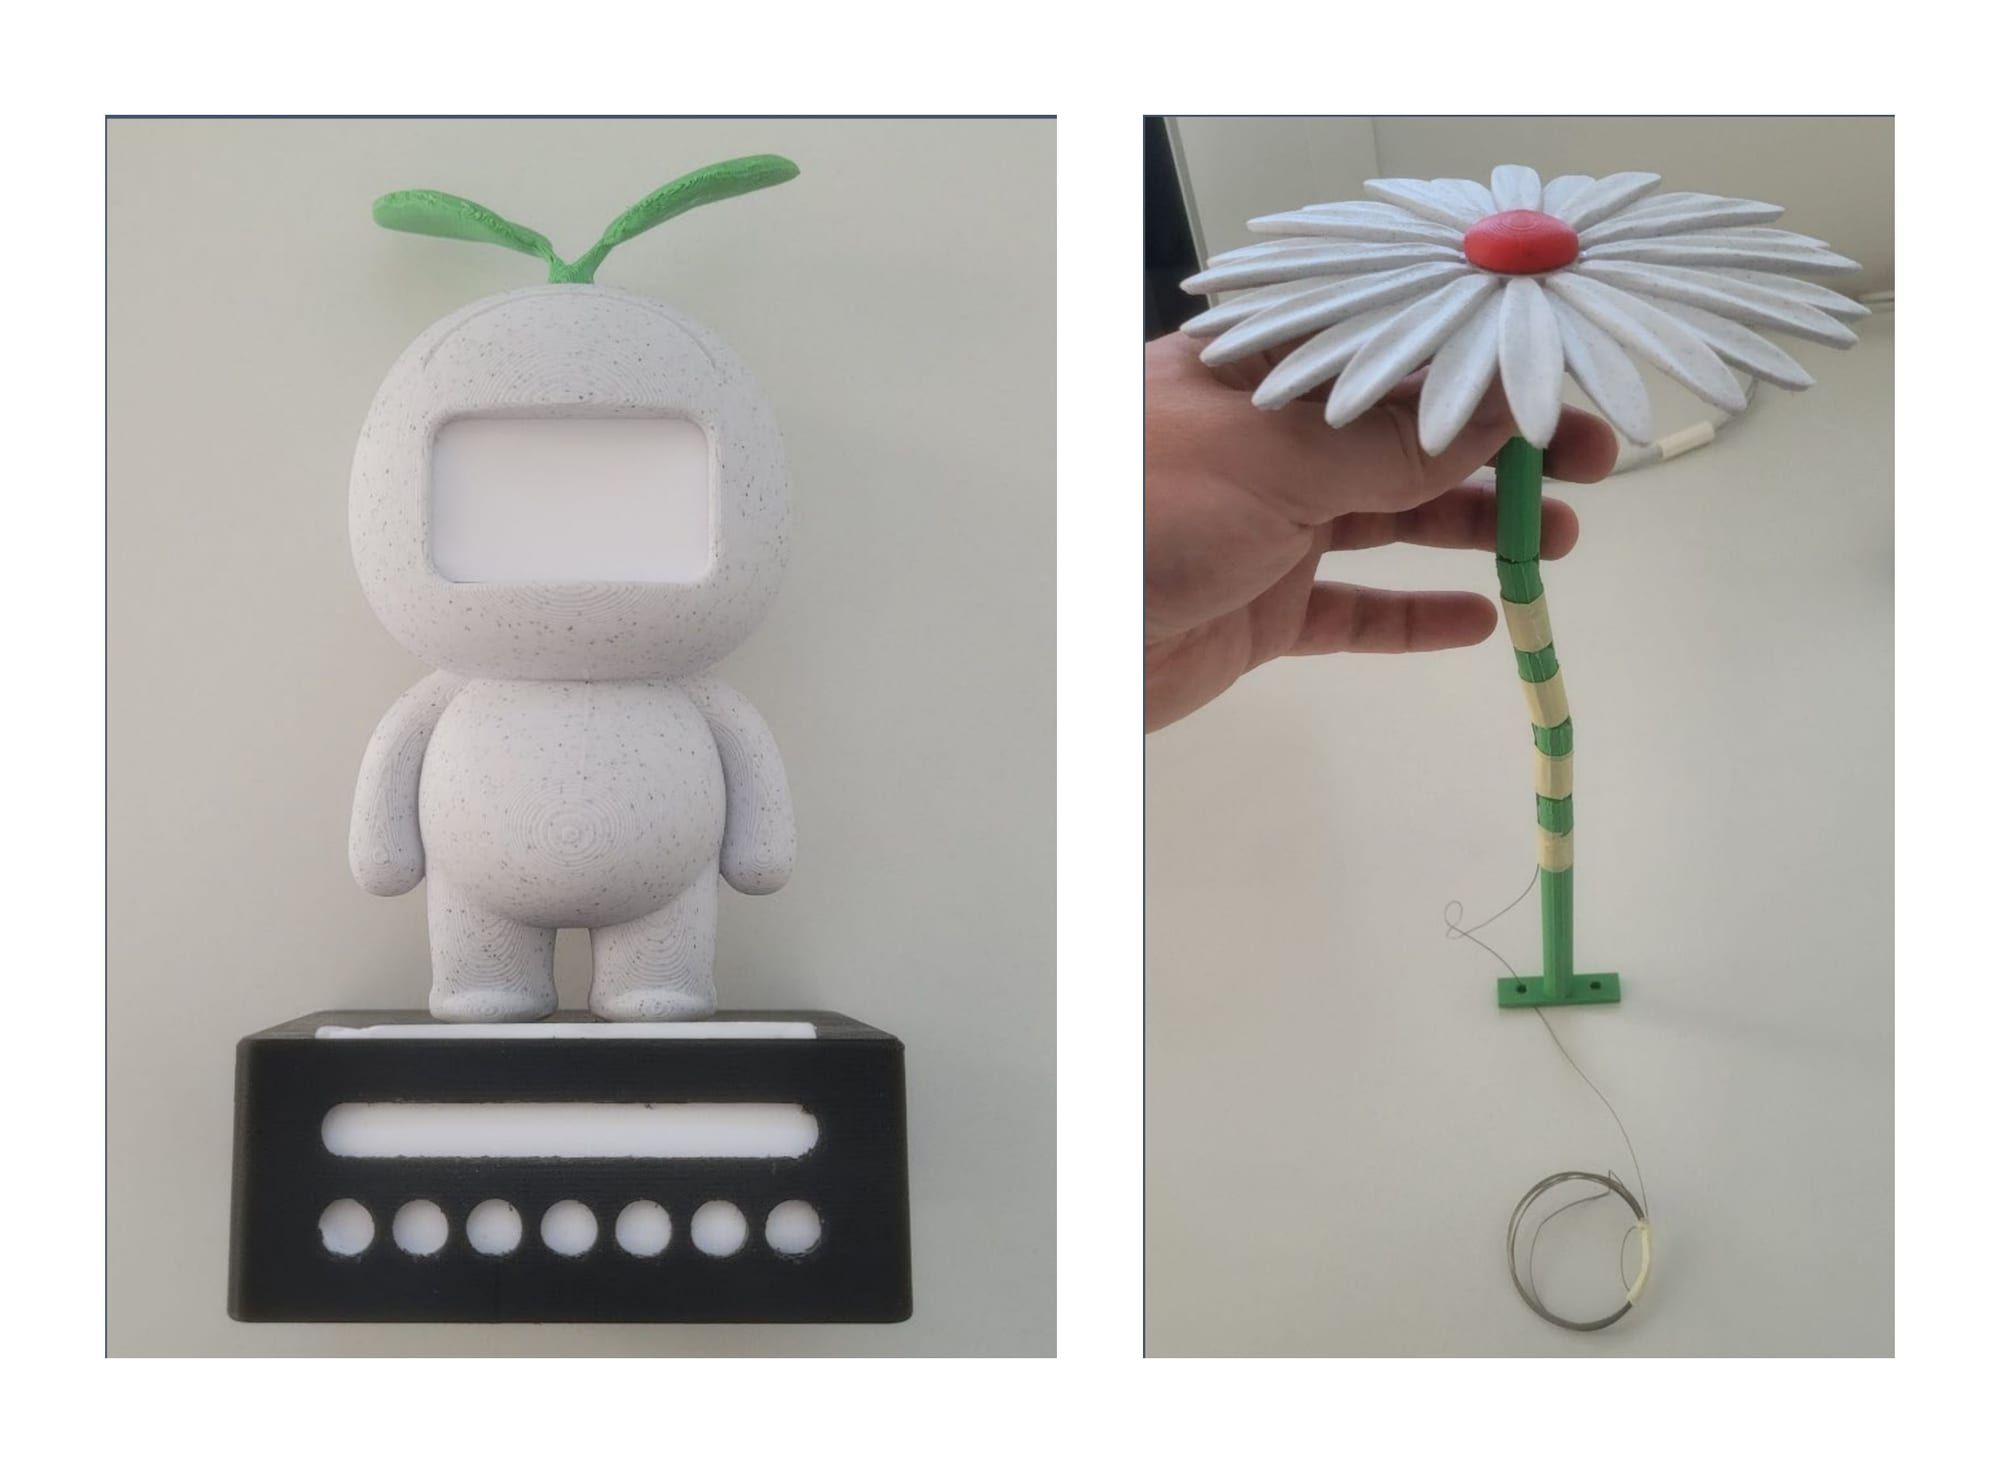
Both concepts were built as low-fidelity, 3D-printed prototypes. Just enough form to read clearly as a character and as a flower, with the complex electronics left out on purpose. The point was to test the metaphor, not the engineering.
The flower's prototype did double duty. It tested whether people understood the wilting as a warning, and whether the motion was even feasible: a cable run through the stem, pulled to straighten it and released to let it bend, as a simple proof of concept of the movement.
A comparative user test put the two side by side. The flower won clearly. Its metaphor was understood without a word of explanation, where the character needed to be read and interpreted first. The flower became the object to build for real.
An ESP32, a servo, a flower
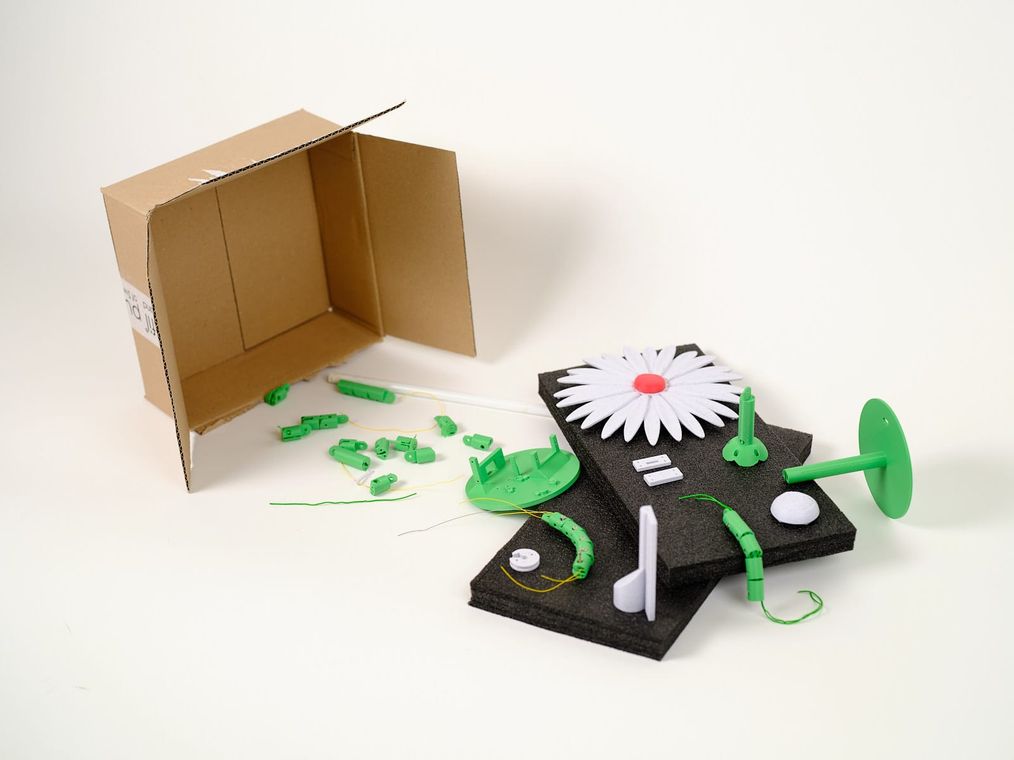
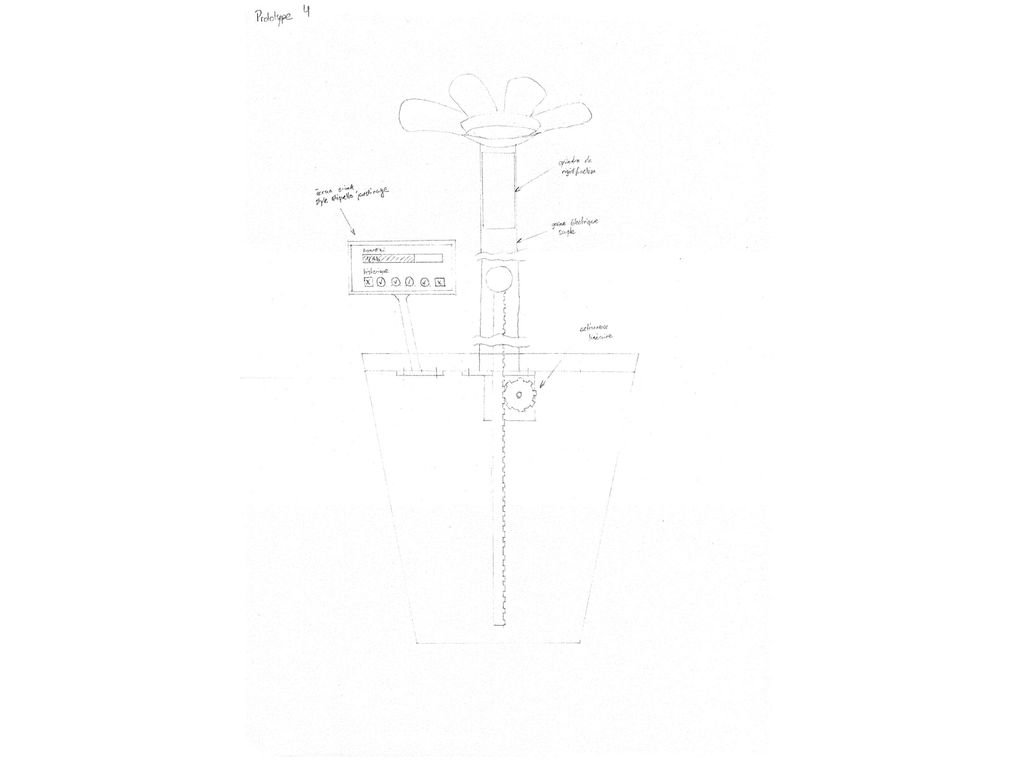
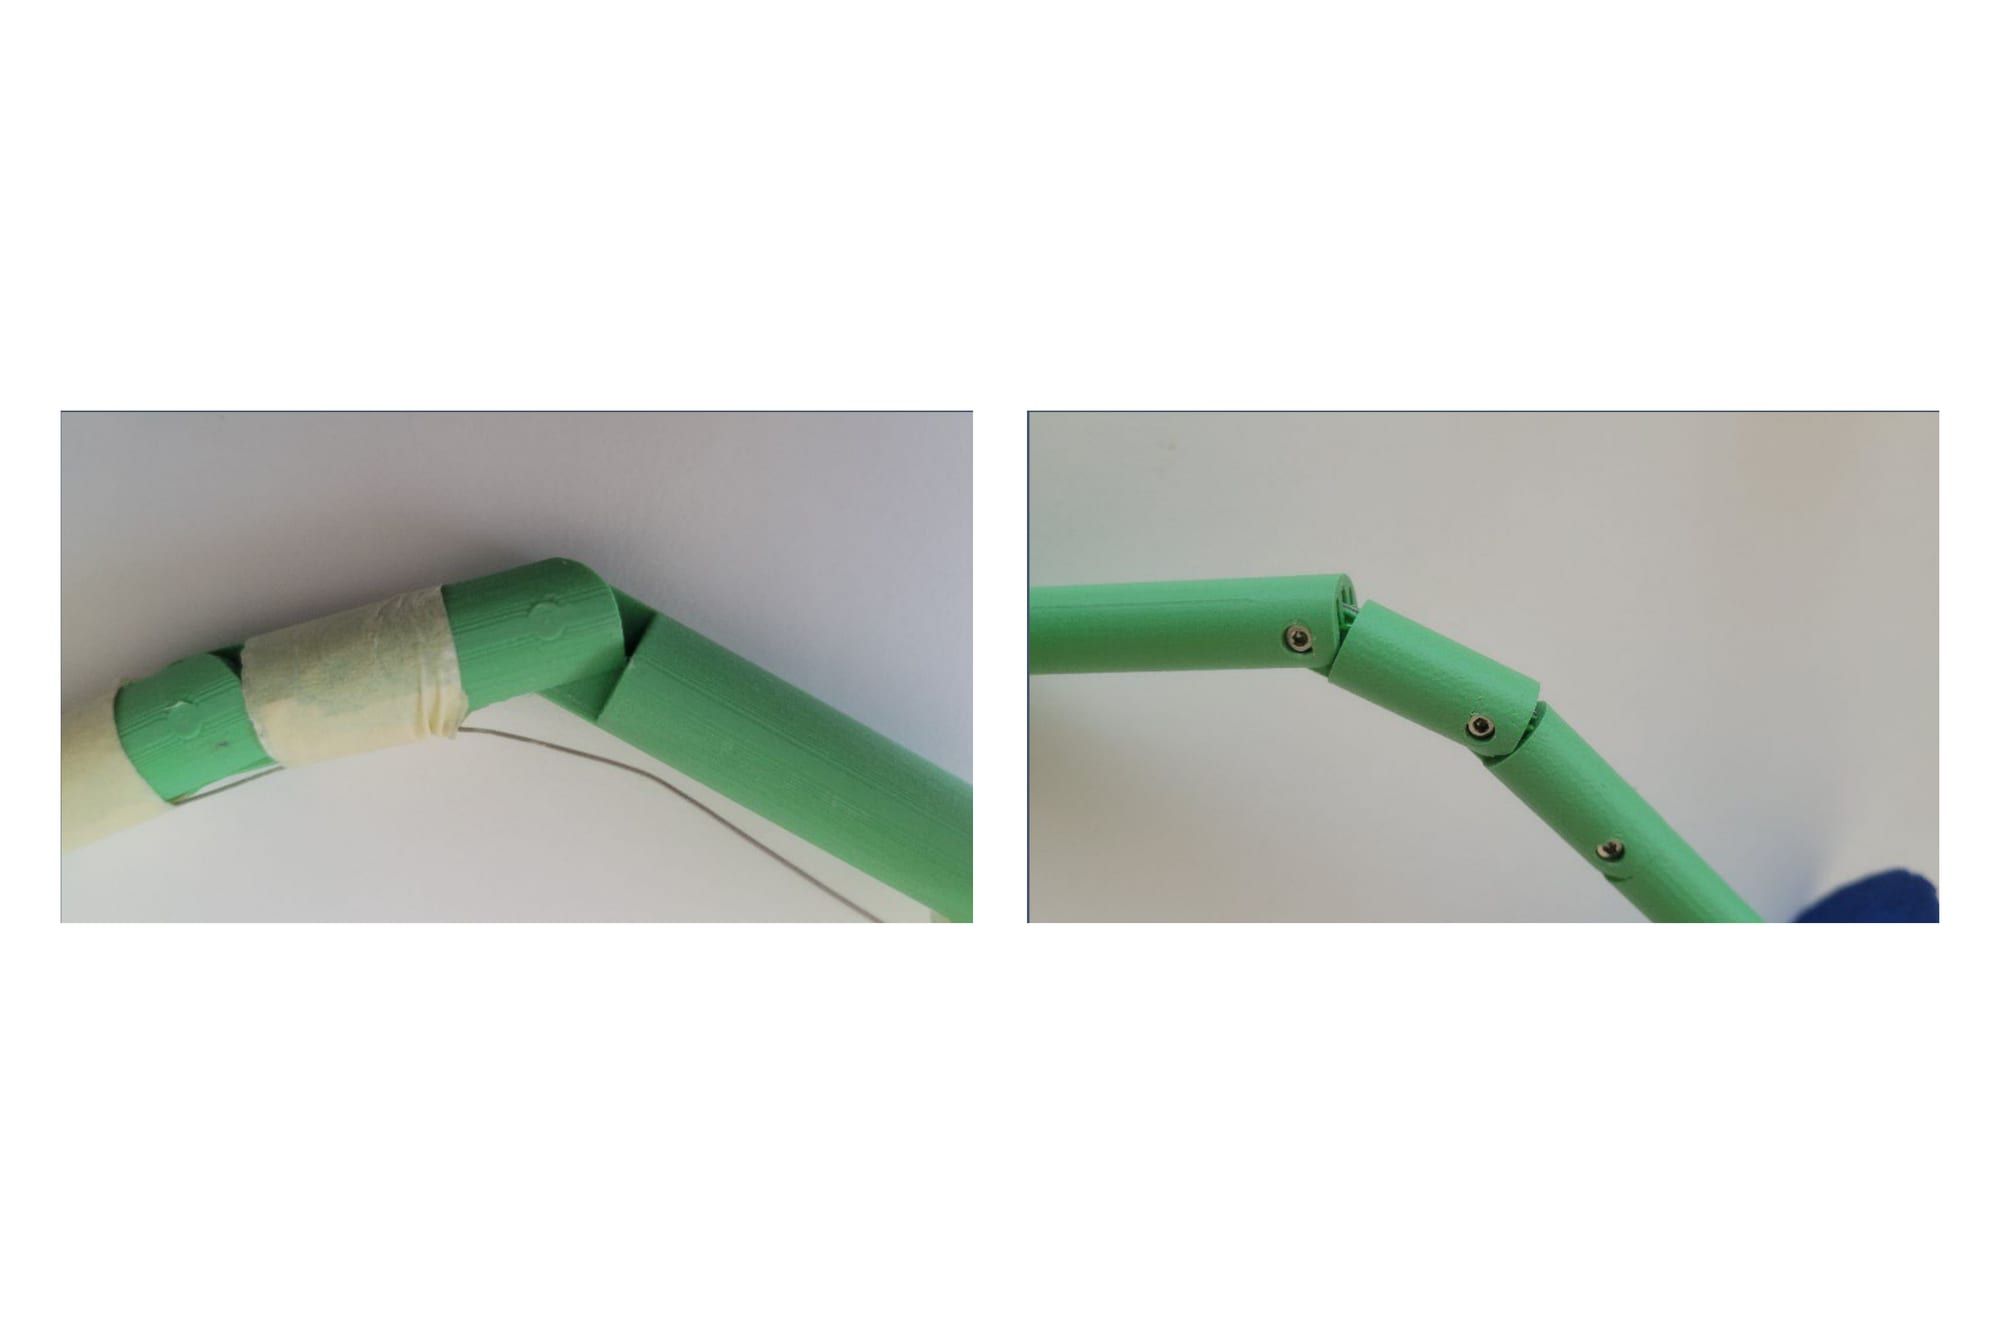
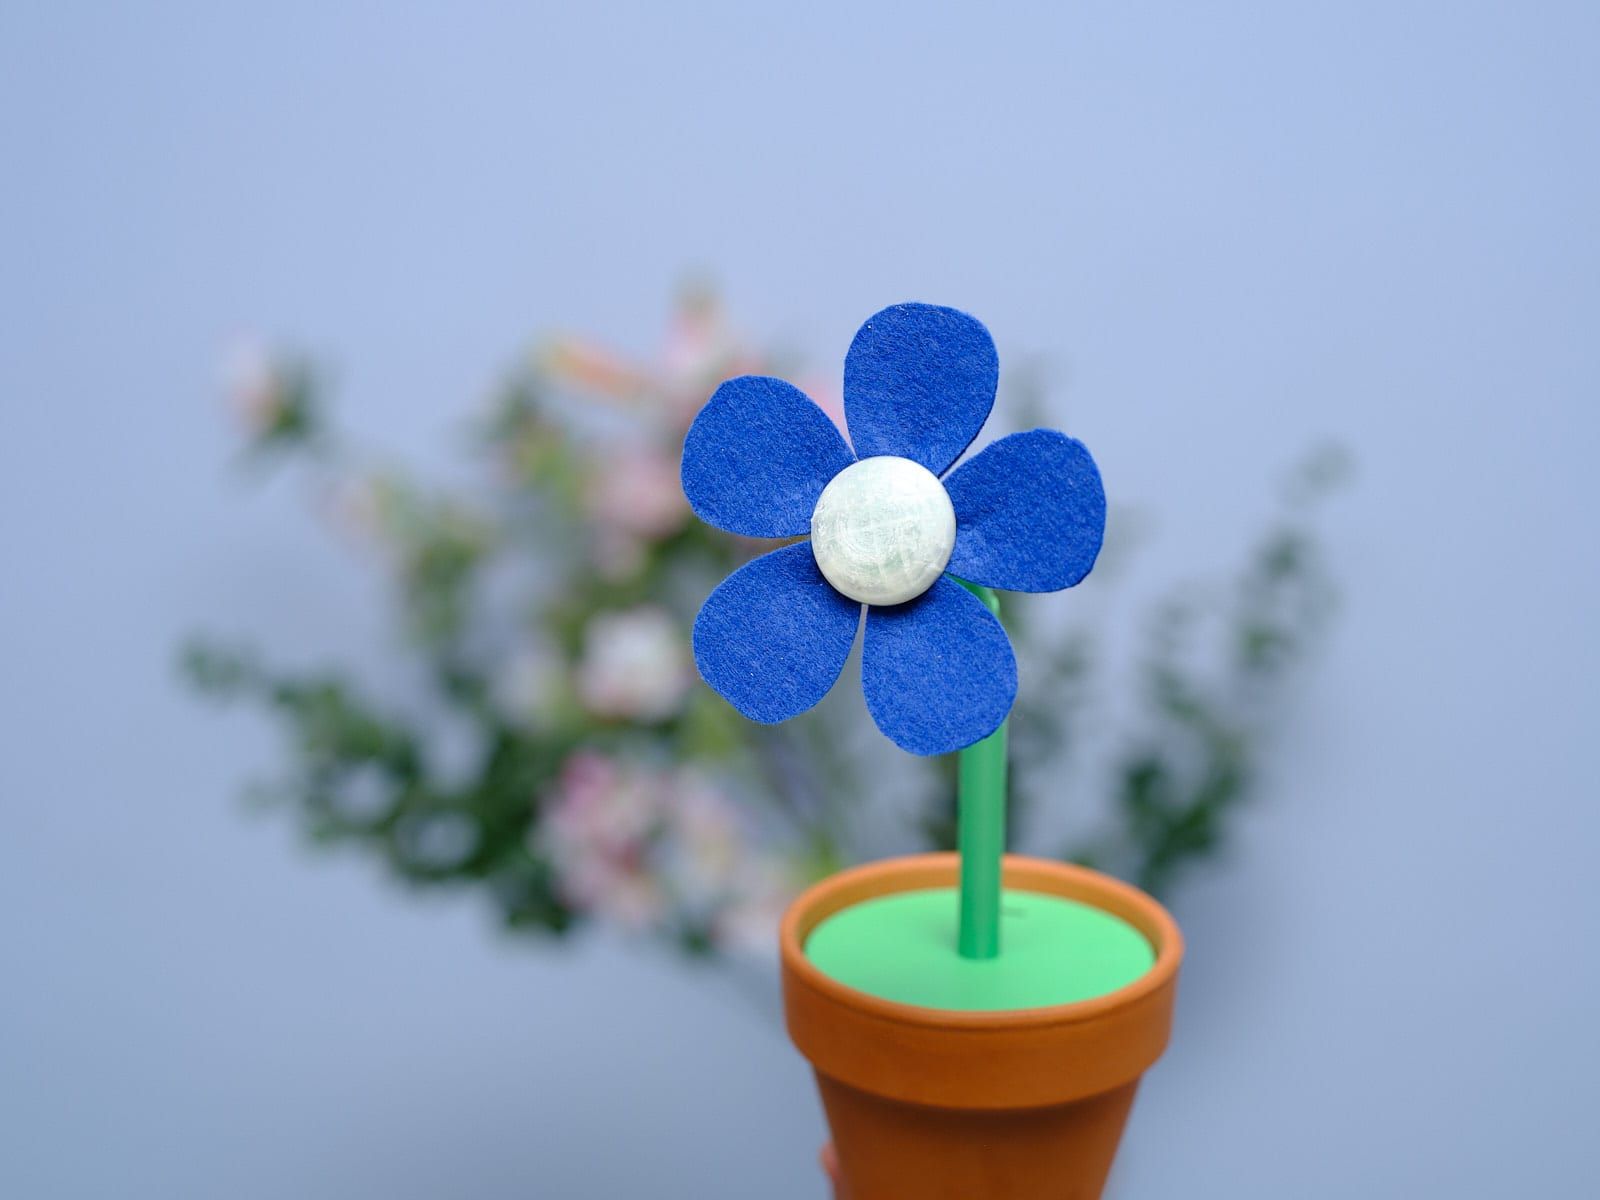
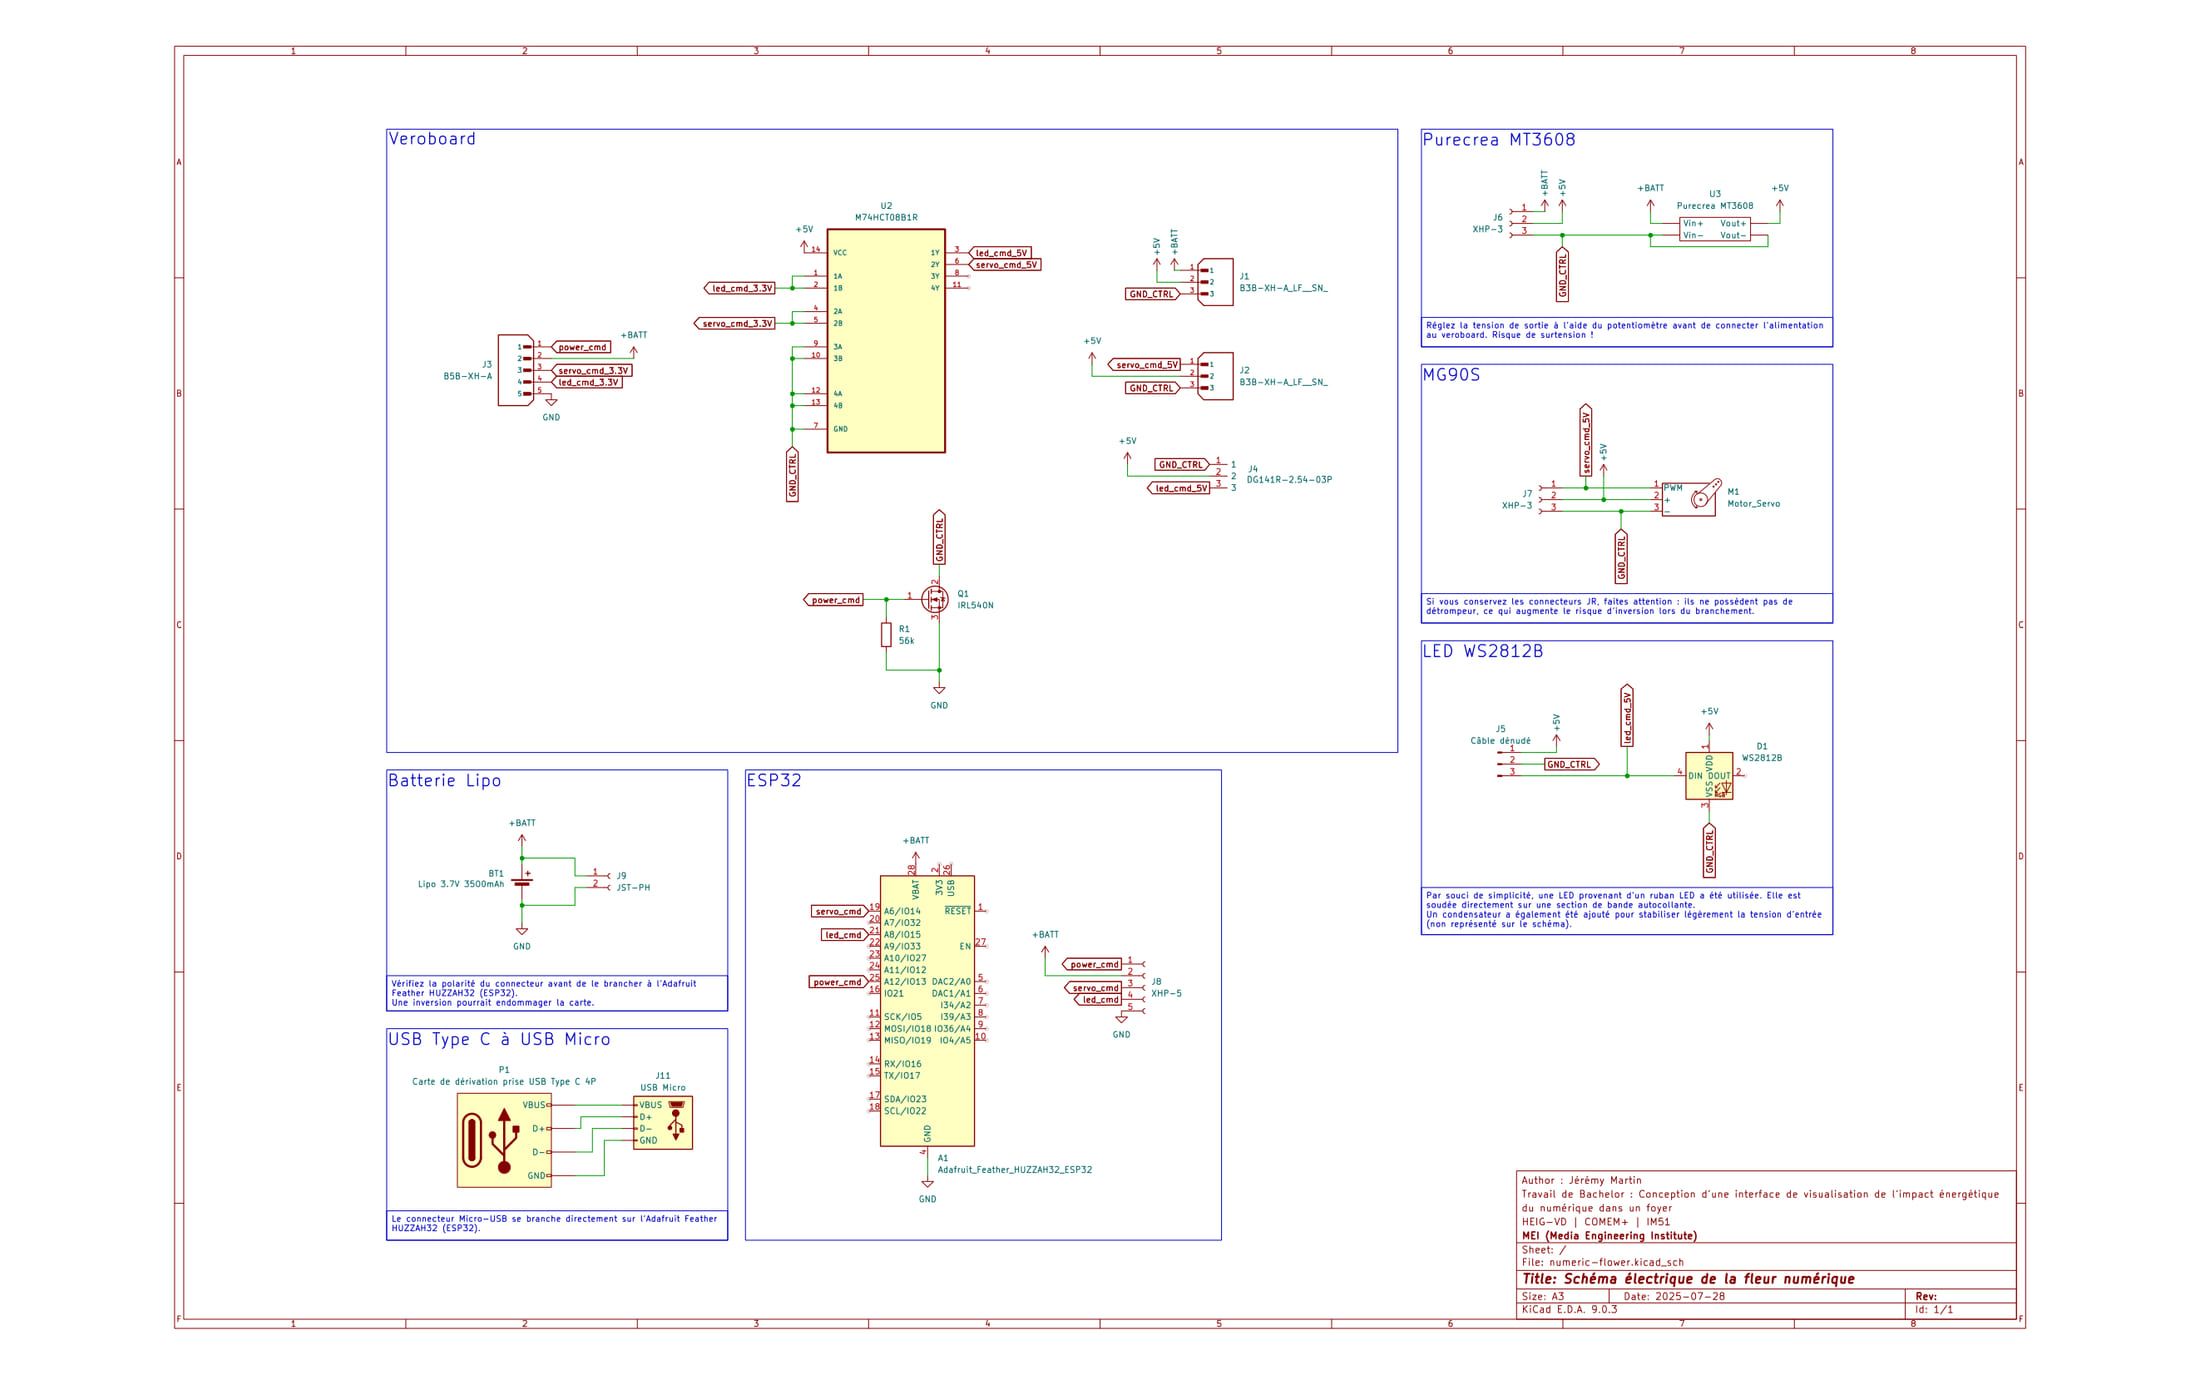
The flower became a functional prototype. The cable proof of concept was upgraded to a servo, driven by an ESP32 that also runs the center light and a deep-sleep circuit, with a local server holding the consumption logic and the device executing posture and light. The stem is segmented, 3D-printed, and joined with M2 screws so it can be taken apart. The petals are felt, chosen for a warmer and less technical feel. The pot is an ordinary terracotta one, so the whole object reads as something that already belongs on a shelf.
Two signals carry the information. The stem's posture shows the household's cumulative digital consumption for the week against a personal threshold, set at install and meant to tighten over time, nudging consumption gently downward. The light at the center signals the instantaneous data rate on a green-to-red scale. The week resets every Monday. That is the entire interaction surface: no screen, no app, no sound.
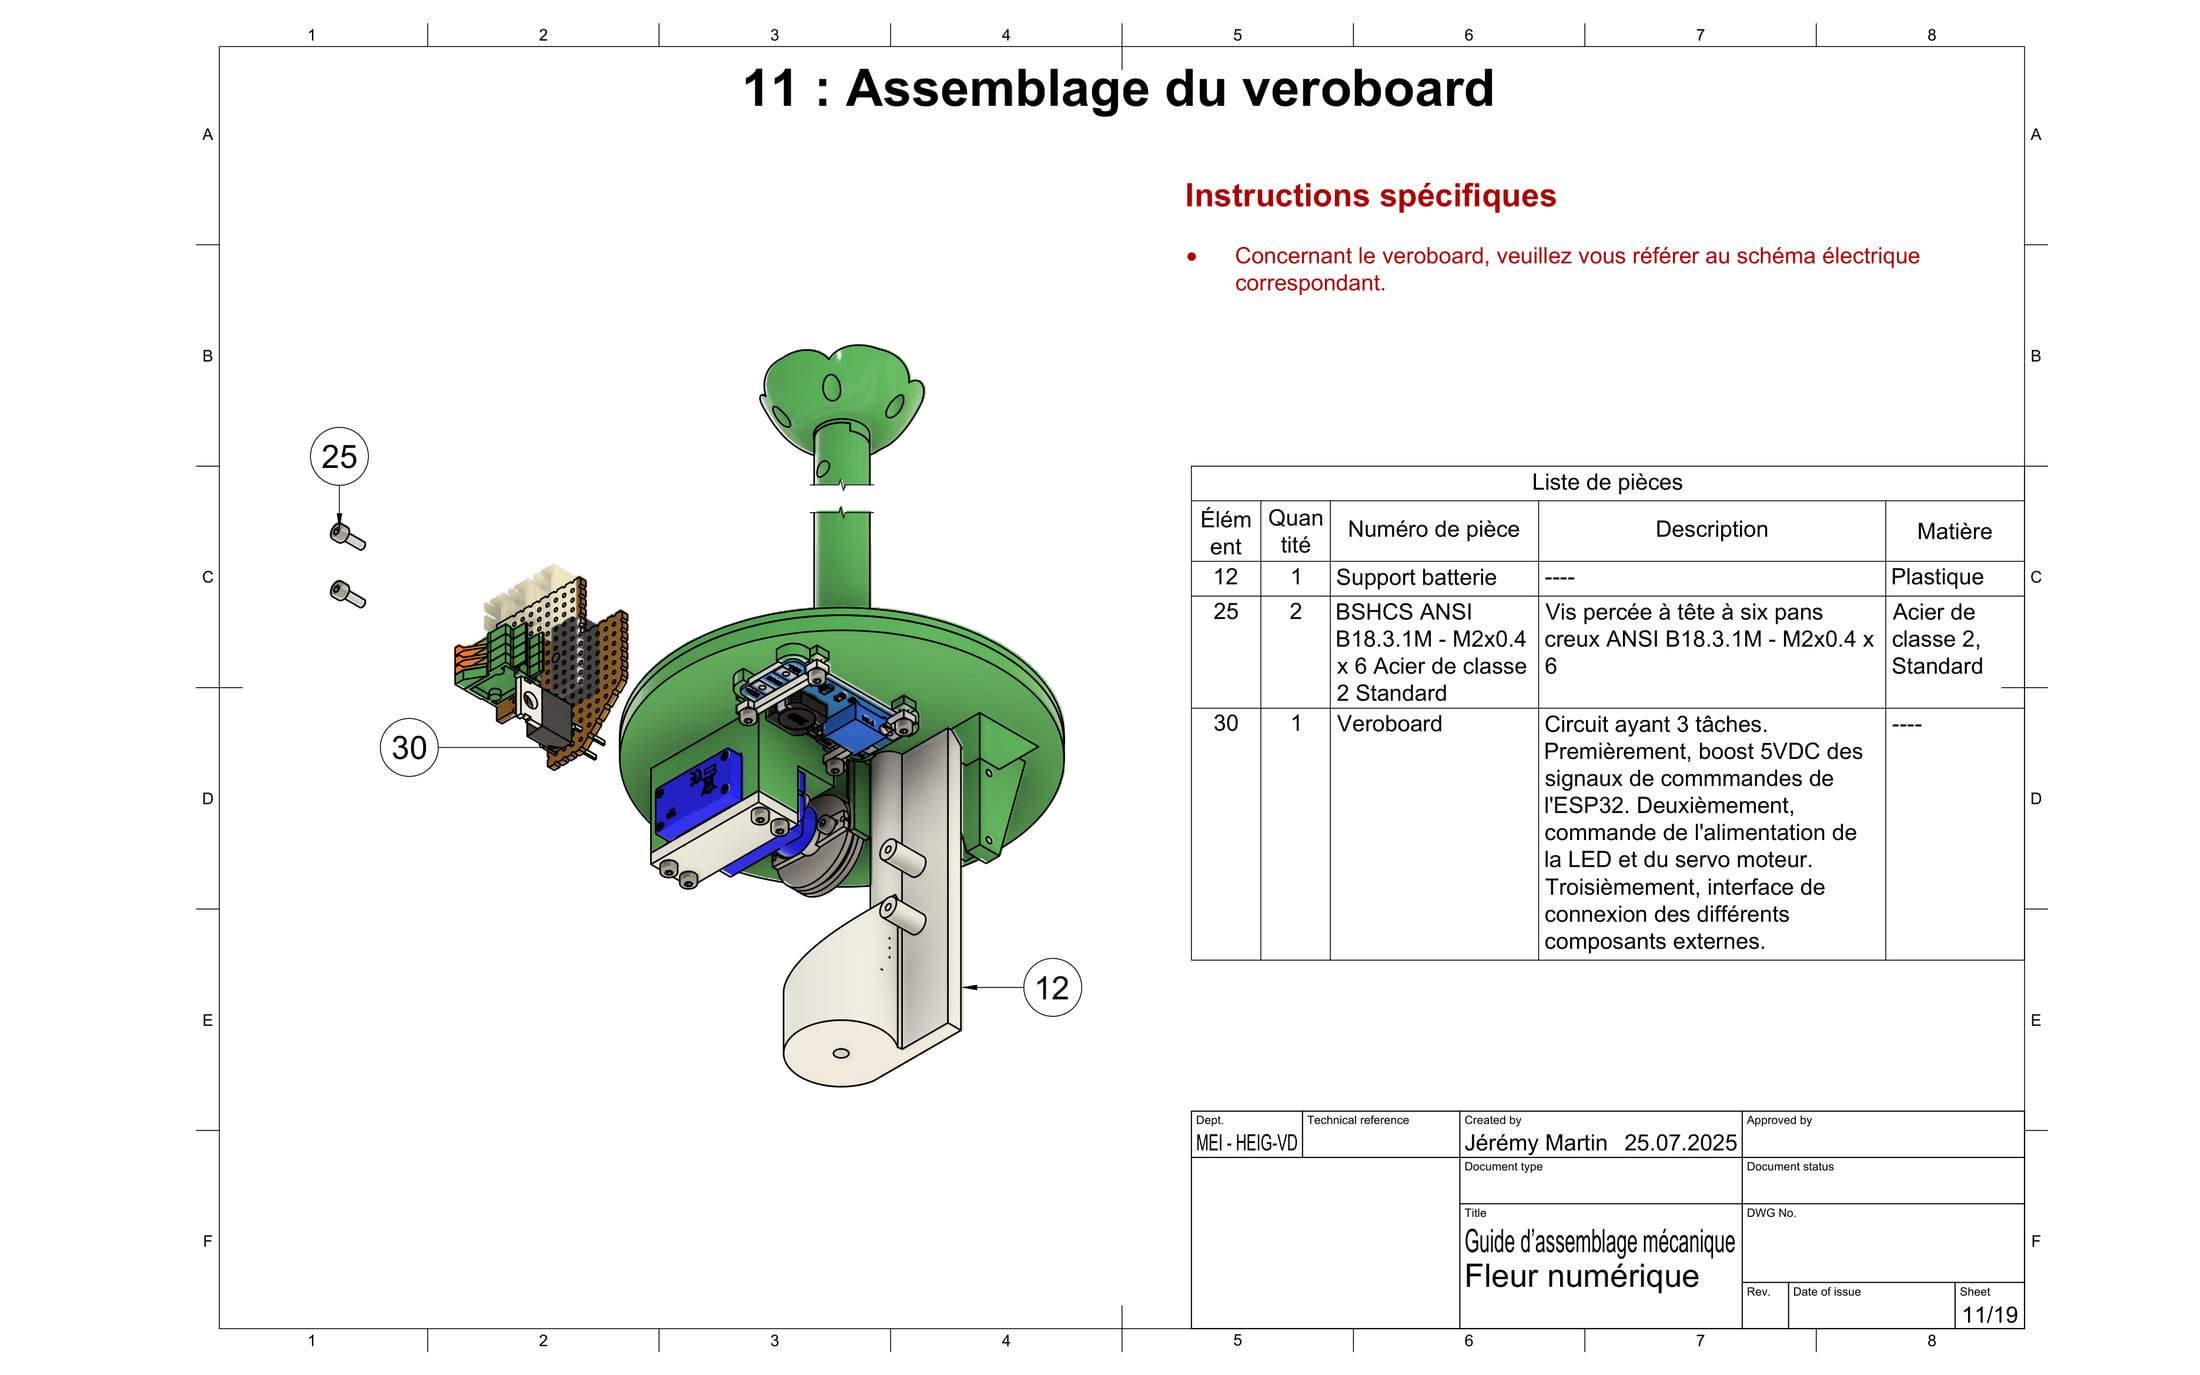
Routing the wiring through a stem that has to bend was the build's longest quiet fight. The first stem was a single printed piece and broke on the third assembly. Splitting it into screw-joined segments let the cables flex without snapping, and made every part replaceable by hand.
What the flower changed
The functional prototype went into a second user test. Four participants, with deliberately varied living situations (a shared flat, living alone, a couple, a family) so the feedback covered a range of homes rather than a single profile.
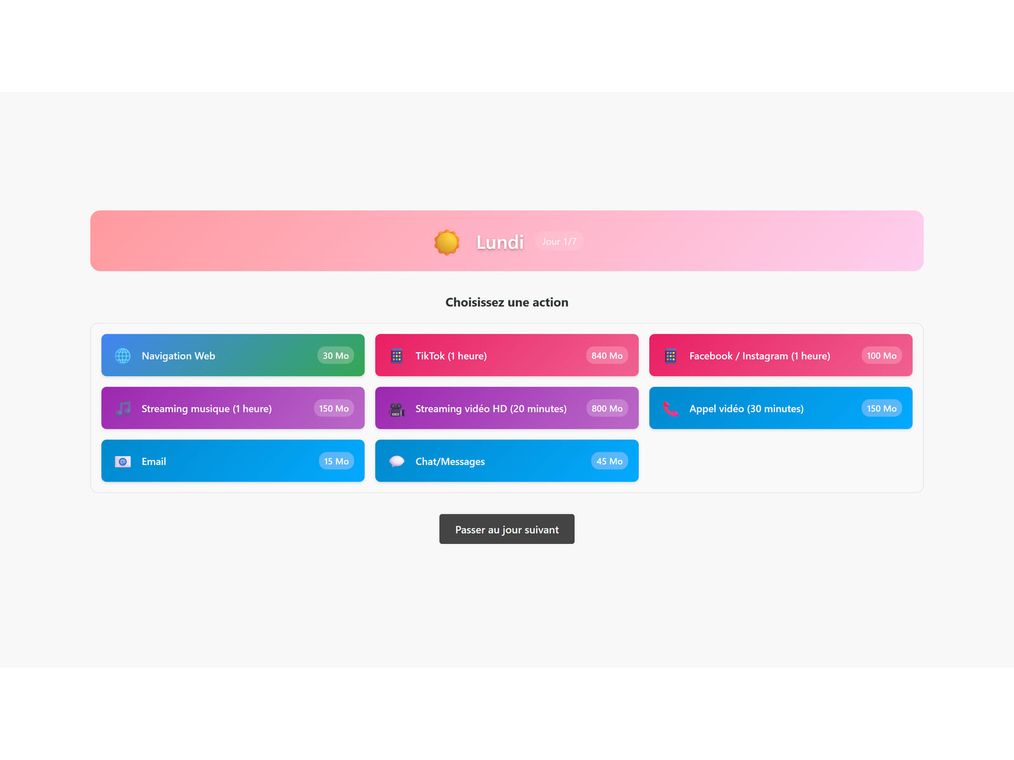
The protocol compressed a week of digital use into ten minutes. Each participant set a personal threshold, worked through a daily activity grid, and watched the flower respond live. The stem was read correctly by everyone, with no explanation needed.
The light was the opposite. It drew the eye every time, but its color code needed explaining, and in the sped-up simulation it ended up echoing the stem instead of showing the live rate. Its real role could not really be observed, and it became the first thing to test properly in a longer study.
The most useful finding was emotional. When the stem visibly bent after a heavy-streaming choice, participants changed their next action mid-task. One stopped and said "ça m'a un peu freiné quand j'ai vu la réaction." Another reframed her own habits: "je pourrais télécharger la musique et l'écouter en local." That register of attention, felt rather than calculated, is the whole point of the object.
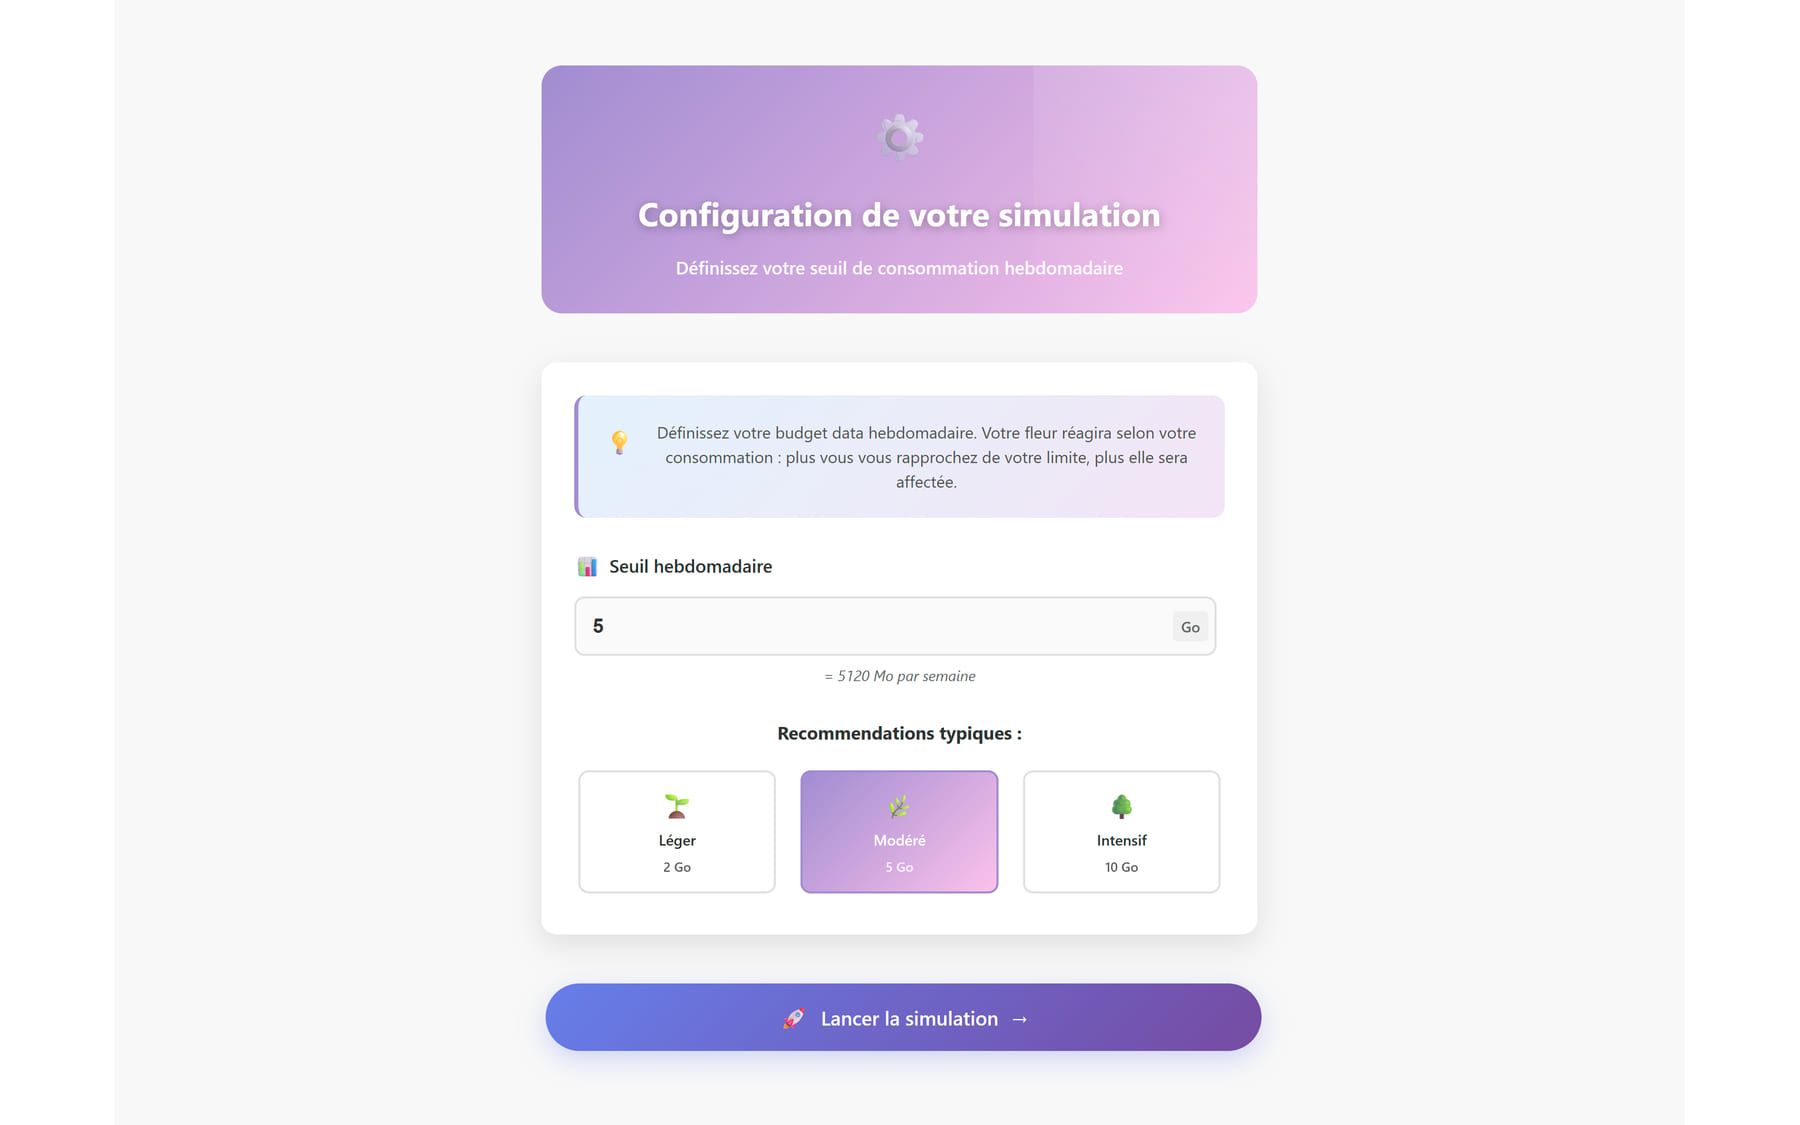
A working functional prototype: stable mechanics, electronics, and firmware, reacting in real time to simulated household data.
Strong recognition. Every participant read the wilting without help, and all of them said they would place the flower in their own home, mostly in a passing spot like an entry table or kitchen counter.
At the thesis defense, the MEI saw a use for it beyond the project: a teaching object, in schools or with children, to make the energy cost of internet use tangible. I handed over a set of recommendations for taking it further, and the MEI later published a write-up on its research blog.
The timeline was the real constraint. With the build compressed into eleven weeks, I never got to run the second iteration the tests pointed to: a gentler wilting curve, a clearer light, and a way for the flower to recover when a household does better. A flower that only ever droops eventually stops motivating. Letting it stand back up again is the next version's job.